Posts tagged "remote-sensing":
Several tonnes of reasons not to go to IGARSS 2020
As every 10 years, IGARSS will take place in Hawaii in 2020. This time it won’t be in Honolulu as in 2000 and 2010, but in Waikoloa, in the “Big Island”.
I went to Honolulu for the 2 previous events, and it would be nice to go there again, visit another place and meet with colleagues and friends that I don’t see often out of this kind of gathering.
But the issue is that, without falling victim of solastalgia, I find it difficult to justify flying for about 50h for a conference. As most of my colleagues, I have done it plenty of times. Thanks to IGARSS and since 1998, I have been to a lot of interesting places and met brilliant people from the remote sensing community. But I find it ironic that people observing our planet from space and measuring how climate and biodiversity are going astray wouldn’t change their behaviour and reduce their impact.
Every IGARSS has a particular theme. Here are the ones for the previous 6:
- Global-Environment Observation and Disaster Mitigation
- Observing, Understanding And Forecasting The Dynamics Of Our Planet
- International Cooperation for Global Awareness
- Advancing the understanding of our living planet
- Understanding the Earth for a safer world
- Energy and our changing planet
In 2020, the theme is Remote Sensing: Global Perspectives for Local Solutions.
One can see that the environment, our living planet, energy etc. are some of the focus of the community who attends these events. This is why the choice of a place which for most of the attendees will need between 12 and 50 hours of travel by plane is questionable. Some may try to get there by other means, but Hawaii is a 6h flight (one way) for everybody.
Let’s do the math. If we assume greenhouse gas emissions of 1/4 tonne CO2 equivalent per hour flying, this is between 3 and 12 tonnes per person (knowing that In order to stop climate change, 0.6 tonnes is the maximum amount of CO2 that can be generated by a single person in a year). Let’s assume an average of 7. IGARSS 2019 in Yokohama had 2600. We can imagine that at least the same amount of people would want to go to Hawaii, although one could argue that Hawaii may attract more people. The calculator says that 18200 tonnes of C02 would be emitted just by flying to IGARSS, that is the maximum amount that 30,000 people can produce in a year if we want to stop climate change.
Of course, this back-of-the-envelope calculation may not be very accurate, but I think that the orders of magnitude are good.
I can only speak for myself, but I don’t think that my contribution to Earth observation that could potentially be used to mitigate climate change and biodiversity degradation is worth the emissions.
Meeting the remote sensing community is useful to advance science and technology, but other ways can be used. The GRSS society has started a new initiative, as announced by its president:
[…] in 2020 we are starting three regional conferences held in locations far from the IGARSS flagship conference. The idea is to help communities that cannot come to IGARSS because of distance, but also because of economic issues or other barriers, and organise dedicated events.
Let’s hope that these events replace the trips to distant venues and do not add up with them!
Sympathy for the Evil: let's help improve Google Earth Engine
Please allow me to introduce a couple of ideas which should help improve the user experience on the GEE platform. I know that Google, a company of wealth and taste, has an impressive record on providing services with outstanding features. They have the best search engine, the best web mail application and the best web browser1.
But these services and tools are targeted to non expert users. With GEE, Google is addressing a complete different audience: scientists, or I should say Scientists. These are clever people with PhD's! Therefore, in order to keep them satisfied Google will have to make an extra effort. One could think that scientists can easily be fooled because, for instance, they agree with giving away to private companies the results of research funded with tax payer money2. Or because they accept to be evaluated by how many times their tweets are liked3. Seeing scientists like this would be a mistake. They are very demanding users who only want to use the best tools4.
But Google has the technology needed to attract this smarter-than-the average users. Here go some ideas which could make GEE the best platform for producing impactful research using remote sensing data.
Executable papers
I think that it would be nice to introduce some literate programming facilities in the code editor. This could be similar to what can be done with Emacs org-mode's Babel or Knitr for the R programming language. This would allow to directly write scientific papers on the GEE editor and keep together notes, formulas, code and charts. Of course, exporting to Google Docs would be also very useful so that results can be integrated in slides or spreadsheets.
The possibility of citing bibliographic references should also be integrated in the editor. I suppose that a Google Scholar search function would not be difficult to add. Oh, yes, and Google Books also, by the way. Actually, using the same technology Google uses to insert advertisements in search results or in Gmail, it would be possible to automatically suggest references based on what the user is writing.
In these suggestions, papers produced using GEE could come first, since they are better. Papers written by people in the author's Google contacts list could also be promoted: good friends cite friends and the content of e-mails should help the algorithms determine if they are collaborators or competitors. But let's trust Google to find the algorithm which will make the best suggestions.
Many software development environments have code completion. In the case of GEE the technology5 would be much more powerful since all the code written by all scientists could be used to make suggestions. The same technology could be used to suggest completions for the text of the papers. We all know how boring is writing again and again the same "introduction" and "materials and methods" sections. Google algorithms could introduce some randomness and even compute a plagiarism score to help us make sure that we comply with the scientific literature standards. Of course, the "Conclusions" section could be automatically produced from the results using Google's AI technology.
It would also be nice to have some kind of warning if the user was designing an experiment or a processing chain that somebody else had already done. So some kind of message like "this has already been done" together with the link to the corresponding paper would be great. Also, automatic checking for patent infringement would be useful. Again, Google has all we need. In this case, the warning message could be "I can't let you do that Dave".
Massive peer review
The executable paper written using what has been described above could be made available through Google Plus as a pre-print. Actually, nobody would call that a "pre-print", but rather a paper in beta. All people in the author's circles could be able to comment on it and, most importantly, give a +1 as a warrant of scientific quality. This approach could quickly be replaced by a more reliable one. Using deep learning (of course, what else?) applied to the training data base freely generated by GEE early adopters, Google could propose an unbiased system for paper review which would be much faster than the traditional peer review approach. The h-index should be abandoned and replaced by the paper-rank metric.
Funding research
Thanks to GEE, doing remote sensing based science will become much cheaper. Universities and research centres won't need to buy expensive computers anymore. Instead, just one Chromebook per person will be enough. Actually, not even offices will be needed, since WiFi is free at Starbucks. Lab meetings can be cheaply replaced by Google Hangouts.
However, scientists will still need some funding, since they can't live on alphaet soup and coffee is still not free at Starbucks. Google has a grant programme for scientists, but this is somewhat old school: real people have to review proposals and even worse, scientists have to spend time writing them.
Again, Google has the technology to help here: "AdSense is a free, simple way to earn money by placing ads on your website." Scientists who would allow ads on their papers, could make some revenue.
Conclusion
I know that in this post I have given away many ideas which could be used to get venture capital for a start-up which could make lots of money, but this would be really unfair, because all this would not be possible without:
- Google Earth Engine
- Gmail
- Google Chrome
- Google Docs
- Google Scholar
- Google Books
- Google Patents
- Google Plus
- +1
- Chromebook
- Google Starbucks
- Google Hangouts
- AdSense
- Google's Youtube
Don't forget that the mission statement of GEE is "developing and sharing new digital mapping technology to save the world". And anyway, section 4.3 of GEE Terms of Service says6:
Customer Feedback. If Customer provides Google Feedback about the Services, then Google may use that information without obligation to Customer, and Customer hereby irrevocably assigns to Google all right, title, and interest in that Feedback.
Footnotes:
They used to have the best RSS reader, but they killed it http://chromespot.com/2013/06/06/google-reader-shutting-down/.
Is Google Earth Engine Evil?
More than for any other post in this blog, the usual disclaimer applies here.
Let's face it: what Google has implemented with the Earth Engine is very appealing since it is the first solution for Earth Observation data exploitation which concentrates all the open access EO data, the computing resources and the processing algorithms. This is the Remote Sensing Scientist dream. Or is it?
Talks and posters at ESA Living Planet Symposium this week show that an increasing number of people are using GEE to do science. One of the reasons put forward is the possibility of sharing the scripts, so that other people can reproduce the results. This is, in my opinion, an incorrect statement. Let's have a look at a definition of reproducible research:
An article about computational science in a scientific publication is not the scholarship itself, it is merely advertising of the scholarship. The actual scholarship is the complete software development environment and the complete set of instructions which generated the figures. —D. Donoho
One important term here is complete. When you use GEE, or any other non free software like Matlab, even if you share your scripts, the core of the algorithms you are using is just a black box which can't be inspected. Actually, the case of GEE is even worse than the one of non free software running locally. Google could change the implementation of the algorithms and your scripts would yield different results without you being able to identify why. Do you remember the "Climategate"? One of the main conclusions was:
… the reports called on the scientists to avoid any such allegations in the future by taking steps to regain public confidence in their work, for example by opening up access to their supporting data, processing methods and software, and by promptly honouring freedom of information requests.
During one of my presentations at the Living Planet Symposium I decided to warn my fellow remote sensers about the issues with GEE and I put a slide with a provocative title. The room was packed with more than 200 people and somebody tweeted this:
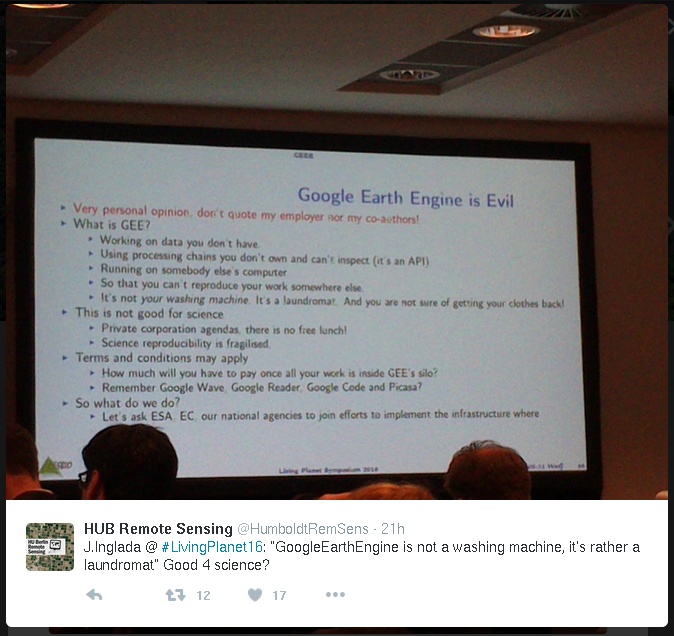
So it seems I was able to get some attention, but a 2-minute slide summarised in a 140 character tweet is not the best medium to start this discussion.
As I said during my presentation, I fully understand why scientists are migrating towards GEE and I don't blame them. Actually, there is nobody to blame here. Not even Google. But in the same way that, after many years of scientists using non free software and publishing in non open access journals, we should take a step back and reflect together about how we want to do Earth Observation Science in a sustainable (which is the perenniality of GEE?) and really open way.
What I was suggesting in the 3 last bullet points in my slide (which don't appear in the tweeted picture1) is that we should ask ESA, the European Commission and our national agencies to join efforts to implement the infrastructure where:
- all data is available;
- and every scientist can log in and build and share libre software for doing science.
And this is much cheaper than launching a satellite.
This is not to criticise what the agencies are doing. ESA's Thematic Exploitation Platforms are a good start. CNES is developing PEPS and Theia which together are a very nice step forward. But I think that a joint effort driven by users' needs coming from the EO Science community would help. So let's speak up and proceed in a constructive way.
Installing OTB has never been so easy
You've heard about the Orfeo Toolbox library and its wonders, but urban legends say that it is difficult to install. Don't believe that. Maybe it was difficult to install, but this is not the case anymore.
Thanks to the heroic work of the OTB core development team, installing OTB has never been so easy. In this post, you will find the step-by-step procedure to compile OTB from source on a Debian 8.0 Jessie GNU/Linux distribution.
Prepare the user account
I assume that you have a fresh install. The procedure below has been tested in a virtual machine running under VirtualBox. The virtual machine was installed from scratch using the official netinst ISO image.
During the installation, I created a user named otb that I will use
for the tutorial below. For simplicity, I give this user root
privileges in order to install some packages. This can be done as
follows. Log in as root or use the command:
su -
You can then edit the /etc/sudoers file by using the following
command:
visudo
This will open the file with the nano text editor. Scroll down to
the lines containing
# User privilege specification
root    ALL=(ALL:ALL) ALL
and copy the second line and below and replace root by otb:
otb ALL=(ALL:ALL) ALL
Write the file and quit by doing C^o ENTER C^x.
Log out and log in as otb. You are set!
System dependencies
Now, let's install some packages needed to compile OTB. Open a
terminal and use aptitude to install what we need:
sudo aptitude install mercurial \
     cmake-curses-gui build-essential \
     qt4-dev-tools libqt4-core \
     libqt4-dev libboost1.55-dev \
     zlib1g-dev libopencv-dev curl \
     libcurl4-openssl-dev swig \
     libpython-dev
Get OTB source code
We will install OTB in its own directory. So from your $HOME
directory create a directory named OTB and go into it:
mkdir OTB
cd OTB
Now, get the OTB sources by cloning the repository (depending on your network speed, this may take several minutes):
hg clone http://hg.orfeo-toolbox.org/OTB
This will create a directory named OTB (so in my case, this is
/home/otb/OTB/OTB).
Using mercurial commands, you can choose a particular version or you can go bleeding edge. You will at least need the first release candidate for OTB-5.0, which you can get with the following commands:
cd OTB
hg update 5.0.0-rc1
cd ../
Get OTB dependencies
OTB's SuperBuild is a procedure which deals with all external libraries needed by OTB which may not be available through your Linux package manager. It is able to download source code, configure and install many external libraries automatically.
Since the download process may fail due to servers which are not
maintained by the OTB team, a big tarball has been prepared for you.
From the $HOME/OTB directory, do the following:
wget https://www.orfeo-toolbox.org/packages/SuperBuild-archives.tar.bz2
tar xvjf SuperBuild-archives.tar.bz2
The download step can be looooong. Be patient. Go jogging or something.
Compile OTB
Once you have downloaded and extracted the external dependencies, you
can start compiling OTB. From the $HOME/OTB directory, create the
directory where OTB will be built:
mkdir -p SuperBuild/OTB
At the end of the compilation, the $HOME/OTB/SuperBuild/ directory
will contain a classical bin/, lib/, include/ and share/
directory tree. The $HOME/OTB/SuperBuild/OTB/ is where the
configuration and compilation of OTB and all the dependencies will be
stored.
Go into this directory:
cd SuperBuild/OTB
Now we can configure OTB using the cmake tool. Since you are on a
recent GNU/Linux distribution, you can tell the compiler to use the
most recent C++ standard, which can give you some benefits even if OTB
still does not use it. We will also compile using the Release option
(optimisations). The Python wrapping will be useful with the OTB
Applications. We also tell cmake where the external dependencies
are. The options chosen below for OpenJPEG make OTB use the gdal
implementation.
cmake \
    -DCMAKE_CXX_FLAGS:STRING=-std=c++14 \
    -DOTB_WRAP_PYTHON:BOOL=ON \
    -DCMAKE_BUILD_TYPE:STRING=Release \
    -DCMAKE_INSTALL_PREFIX:PATH=/home/otb/OTB/SuperBuild/ \
    -DDOWNLOAD_LOCATION:PATH=/home/otb/OTB/SuperBuild-archives/ \
    -DOTB_USE_OPENJPEG:BOOL=ON \
    -DUSE_SYSTEM_OPENJPEG:BOOL=OFF \
    ../../OTB/SuperBuild/
After the configuration, you should be able to compile. I have 4 cores
in my machine, so I use the -j4 option for make. Adjust the value
to your configuration:
make -j4
This will take some time since there are many libraries which are going to be built. Time for a marathon.
Test your installation
Everything should be compiled and available now. You can set up some
environment variables for an easier use of OTB. You can for instance
add the following lines at the end of $HOME/.bashrc:
export OTB_HOME=${HOME}/OTB/SuperBuild
export PATH=${OTB_HOME}/bin:$PATH
export LD_LIBRARY_PATH=${OTB_HOME}/lib
You can now open a new terminal for this to take effect or use:
cd
source .bashrc
You should now be able to use the OTB Applications. For instance, the command:
otbcli_BandMath
should display the documentation for the BandMath application.
Another way to run the applications, is using the command line application launcher as follows:
otbApplicationLauncherCommandLine BandMath $OTB_HOME/lib/otb/applications/
Conclusion
The SuperBuild procedure allows to easily install OTB without having to deal with different combinations of versions for the external dependencies (TIFF, GEOTIFF, OSSIM, GDAL, ITK, etc.).
This means that once you have cmake and a compiler, you are pretty
much set. QT4 and Python are optional things which will be useful for
the applications, but they are not required for a base OTB
installation.
I am very grateful to the OTB core development team (Julien, Manuel, Guillaume, the other Julien, Mickaël, and maybe others that I forget) for their efforts in the work done for the modularisation and the development of the SuperBuild procedure. This is the kind of thing which is not easy to see from the outside, but makes OTB go forward steadily and makes it a very mature and powerful software.
A simple thread pool to run parallel PROSail simulations
In the otb-bv we use the OTB versions of the Prospect and Sail models to perform satellite reflectance simulations of vegetation.
The code for the simulation of a single sample uses the ProSail simulator configured with the satellite relative spectral responses, the acquisition parameters (angles) and the biophysical variables (leaf pigments, LAI, etc.):
ProSailType prosail;
prosail.SetRSR(satRSR);
prosail.SetParameters(prosailPars);
prosail.SetBVs(bio_vars);
auto result = prosail();
A simulation is computationally expensive and it would be difficult to parallelize the code. However, if many simulations are going to be run, it is worth using all the available CPU cores in the machine.
I show below how using C++11 standard support for threads allows to easily run many simulations in parallel.
Each simulation uses a set of variables given in an input file. We parse the sample file in order to get the input parameters for each sample and we construct a vector of simulations with the appropriate size to store the results.
otbAppLogINFO("Processing simulations ..." << std::endl);
auto bv_vec = parse_bv_sample_file(m_SampleFile);
auto sampleCount = bv_vec.size();
otbAppLogINFO("" << sampleCount << " samples read."<< std::endl);
std::vector<SimulationType> simus{sampleCount};
The simulation function is actually a lambda which will sequentially
process a sequence of samples and store the results into the simus
vector. We capture by reference the parameters which are the same for
all simulations (the satellite relative spectral responses satRSR
and the acquisition angles in prosailPars):
auto simulator = [&](std::vector<BVType>::const_iterator sample_first,
                     std::vector<BVType>::const_iterator sample_last,
                     std::vector<SimulationType>::iterator simu_first){
  ProSailType prosail;
  prosail.SetRSR(satRSR);
  prosail.SetParameters(prosailPars);
  while(sample_first != sample_last)
    {
    prosail.SetBVs(*sample_first);
    *simu_first = prosail();
    ++sample_first;
    ++simu_first;
    }
};
We start by figuring out how to split the simulation into concurrent threads. How many cores are there?
auto num_threads = std::thread::hardware_concurrency();
otbAppLogINFO("" << num_threads << " CPUs available."<< std::endl);
So we define the size of the chunks we are going to run in parallel and we prepare a vector to store the threads:
auto block_size = sampleCount/num_threads;
if(num_threads>=sampleCount) block_size = sampleCount;
std::vector<std::thread> threads(num_threads);
Here, I choose to use as many threads as cores available, but this could be changed by a multiplicative factor if we know, for instance that disk I/O will introduce some idle time for each thread.
An now we can fill the vector with the threads that will process every block of simulations :
auto input_start = std::begin(bv_vec);
auto output_start = std::begin(simus);
for(size_t t=0; t<num_threads; ++t)
  {
  auto input_end = input_start;
  std::advance(input_end, block_size);
  threads[t] = std::thread(simulator,
                           input_start,
                           input_end,
                           output_start);
  input_start = input_end;
  std::advance(output_start, block_size);
  }
The std::thread takes the name of the function object to be called,
followed by the arguments of this function, which in our case are the
iterators to the beginning and the end of the block of samples to be
processed and the iterator of the output vector where the results will
be stored. We use std::advance to update the iterator positions.
After that, we have a vector of threads which have been started
concurrently. In order to make sure that they have finished before
trying to write the results to disk, we call join on each thread,
which results in waiting for each thread to end:
std::for_each(threads.begin(),threads.end(),
              std::mem_fn(&std::thread::join));
otbAppLogINFO("" << sampleCount << " samples processed."<< std::endl);
for(const auto& s : simus)
  this->WriteSimulation(s);
This may no be the most efficient solution, nor the most general
one. Using std::async and std::future would have allowed not to
have to deal with block sizes, but in this solution we can easily decide
the number of parallel threads that we want to use, which may be useful
in a server shared with other users.
Should we always normalize image features before classification?
The quick answer is of course not. But if I am writing this post is because I have been myself giving a rule of thumb to students for a while without explaining the details.
When performing image classification (supervised or unsupervised) I always tell students to normalize the features. This normalization can be for instance just standardization (subtract the mean and divide by the standard deviation), although other approaches are possible.
The goal of this normalization is being able to compare apples and oranges: many classification algorithms are based on a distance in the feature space, and in order to give equal weight to all features, they have to have similar ranges. For instance, if we have 2 features like the NDVI, which ranges from -1 to 1, and the slope of a topographic surface which could be between \(0^\circ\) and \(90^\circ\), the Euclidean distance would give much more weight to the slope and the NDVI values would not have much influence in the classification.
This is why the TrainImagesClassifier and the ImageClassifier
applications in the ORFEO Toolbox have the option to provide a
statistics file with the mean and standard deviation of the features
so they samples can be normalized.
This is needed for classifiers like SVM, unless custom kernels suited to particular sets of features are used.
Most OTB users have started using the Random Forest classifier since it was made available by the integration of the OpenCV Machine Learning module. And not long ago, someone told me that she did not notice any difference with and without feature normalization. Let's see why.
A Random Forest classifier uses a committee of decision trees. The decision trees split the samples at each node of the tree by thresholding one single feature. The learning of the classifier amounts basically at finding the value of the threshold at each node which is the optimum to split the samples.
The decision trees used by the Random Forest implementation in OpenCV use the Gini impurity in order to find the best split1. At any node of the tree during the learning, the samples are sorted in increasing order of the feature. Then all possible threshold values are used to split the samples into 2 sets and the Gini impurity is computed for every possible split. The impurity index does not use the values of the features, but only the labels of the samples. The values of the features are only used in order to sort the samples.
Any pre-processing of the features which is monotonic will not change the value of the Gini impurity and therefore will have no effect on the training of a Random Forest classifier.
Footnotes:
Actually, a variant of the Gini impurity is used, but this does not change the rationale here.
On the usefulness of non-linear indices for remote sensing image classification
Not long ago, after a presentation about satellite image time series classification for land cover map production, someone asked me about the real interest of using non-linear radiometric indices as features for the classification.
By non-linear radiometric indices, I mean non-linear combinations of the reflectances of the different spectral bands. The most current example is the NDVI:
\[NDVI = \frac{NIR-Red}{NIR+Red}\]
Many other examples are listed in the Orfeo Toolbox wiki and they are useful for vegetation, but also for other kinds of surfaces like water, bare soils, etc.
The question is really interesting, since if we use a “good enough” classifier, it should be able to efficiently use the spectral reflectances without needing us to find clever combinations of them.
Actually, in terms of information theory, the amount of information given to the classifier is exactly the same if we provide it with the reflectances or with the reflectances and non-linear combinations of them.
The fact is that many classifiers, like decision trees or linear SVM, are only able to perform linear or piece-wise linear separations in the feature space, and therefore, non-linear combinations of the input features should help them.
On the other hand, most of these non-linear indices follow the same template as the NDVI: they are normalised differences of 2 bands. Therefore, the non-linearity is not very strong.
The following figure shows the shape of the NDVI as a function of the 2 reflectances used to compute it.
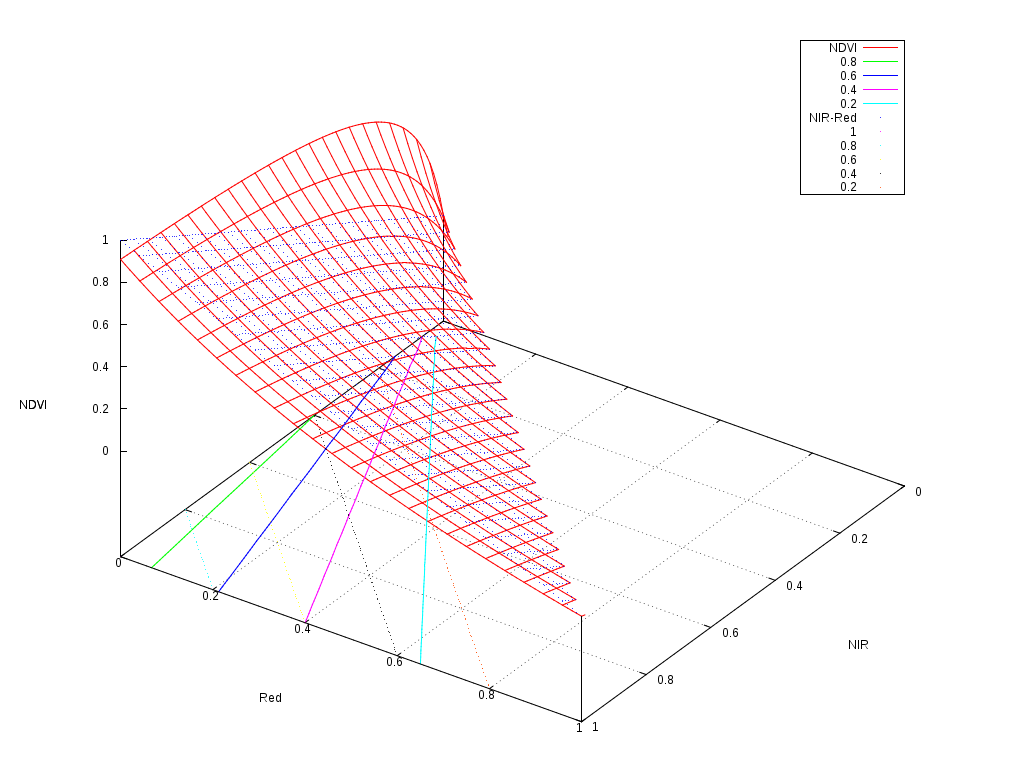
As one can see, it follows a plane with a slight non-linearity for the low reflectances. The contour plots are the solid colour lines, which are rather linear. So why we find that classifications often work better when we use this kind of indices?
The answer seems to reside in the distortion of the dynamics of the values.
If we have a look at the floor of the picture, we can imagine how a classifier would work.
The simplest classifier, that is a binary thresholding of the reflectances could only build a decision function following the black dotted grid, that is boundaries perpendicular to the axis. A decision tree, is just a set of thresholds on the features, and therefore, it could model a decision function which would be composed of a step functions on this plane, but always perpendicular and parallel to the axis.
On the other hand, a linear perceptron or a linear SVM, could build a decision function which would correspond to any straight line crossing this plane. An example of these lines would be the colour dotted lines representing the \(NIR-Red\) values. Any linear combination of the features would work like this.
It seems therefore, that a linear classifier could draw a boundary between a pair of solid colour lines, and therefore efficiently split the feature space as if the NDVI was available.
The interesting thing to note is that the NDVI contour plots are nearly straight lines, but they are not parallel. This introduces a kind of non-linear normalisation of the features which makes the job of the classifier easier.
And what about non-linear classifiers like multi-layer perceptrons or Gaussian SVM? Do they need these non-linear indices? The theoretical answer is “no, they don't”. But the pragmatic answer should be “please, be nice to your classifier”.
Most of the learning algorithms in the literature are based on the optimisation of cost functions. The easier the problem to solve, the higher the chances to get a robust classifier. In the case of SVM, this will result into a larger margin. In the case of Neural Networks, this will lead to a lesser chance of over-fitting.
Another thing to take into account is that cost functions in machine learning problems are based on distances, and most of the time the Euclidean distance is used. It is therefore useful to tune the features in order to give them the appropriate weight into this distance. In other words, if vegetation presence is something which conveys useful information for the classification, use the NDVI so that your classifier knows that1.
Finally, non-linear classifiers are usually more computationally expensive than linear ones, both at the learning and at the inference step. Therefore, it is usually more effective to put the intelligence in the design of the features and use a simpler classifier than using raw features and a very sophisticated classifier.
Of course, all this advice is derived from a mix of the knowledge of the algorithms and the experience in using them for a particular kind of problem: remote sensing image supervised classification for land cover map production. For other applications in computer vision (like object recognition) or other completely unrelated fields, the advice might be different.
Footnotes:
Some call this prior knowledge, others call it common sense.
Is open and free global land cover mapping possible?
Short answer: yes.
Mid November took place in Toulouse "Le Capitole du libre", a conference on Free Software and Free Culture. The program this year was again full of interesting talks and workshops.
This year, I attended a workshop about contributing to Openstreetmap (OSM) using the JOSM software. The workshop was organised by Sébastien Dinot who is a massive contributor to OSM, and more importantly a very nice and passionate fellow.
I was very happy to learn to use JOSM and did 2 minor contributions right there.
During the workshop I learned that, over the past, OSM has been enriched using massive imports from open data sources, like for instance cadastral data bases from different countries or the Corine Land Cover data base. This has been possible thanks to the policies of many countries which have understood that the commons are important for the advancement of society. One example of this is the European INSPIRE initiative.
I was also interested to learn that what could be considered niche data, like agricultural land parcel data bases as for instance the French RPG have also been imported into OSM. Since I have been using the RPG at work for the last 4 years (see for example here or here), I was sympathetic with the difficulties of OSM contributors to efficiently exploit these data. I understood that the Corine Land Cover import was also difficult and the results were not fully satisfactory.
As a matter of fact, roads, buildings and other cartographic objects are easier to map than land cover, since they are discrete and sparse. They can be pointed, defined and characterised more easily than natural and semi-natural areas.
After that, I could not avoid making the link with what we do at work in terms of preparing the exploitation of upcoming satellite missions for automatic land cover map production.
One of our main interests is the use of Sentinel-2 images. It is the week end while I am writing this, so I will not use my free time to explain how land cover map production from multi-temporal satellite images work: I already did it in my day job.
What is therefore the link between what we do at work and OSM? The revolutionary thing from my point of view is the fact that Sentinel-2 data will be open and free, which means that the OSM project could use it to have a constantly up to date land cover layer.
Of course, Sentinel-2 data will come in huge volumes and a good amount of expertise will be needed to use them. However, several public agencies are paving the road in order to deliver data which is easy to use. For instance, the THEIA Land Data Centre will provide Sentinel-2 data which is ready to use for mapping. The data will be available with all the geometric and radiometric corrections of the best quality.
Actually, right now this is being done, for instance, for Landsat imagery. Of course, all these data is and will be available under open and free licences, which means that anyone can start right now learning how to use them.
However, going from images to land cover maps is not straightforward. Again, a good deal of expertise and efficient tools are needed in order to convert pixels into maps. This is what I have the chance to do at work: building tools to convert pixels into maps which are useful for real world applications.
Applying the same philosophy to tools as for data, the tools we produce are free and open. The core of all these tools is of course the Orfeo Toolbox, the Free Remote Sensing Image Processing Library from CNES. We have several times demonstrated that the tools are ready to efficiently exploit satellite imagery to produce maps. For instance, in this post here you even have the sequence of commands to generate land cover maps using satellite image time series.
This means that we have free data and free tools. Therefore, the complete pipeline is available for projects like OSM. OSM contributors could start right now getting familiar with these data and these tools.
Head over to CNES servers to get some Landsat data, install OTB, get familiar with the classification framework and see what could be done for OSM.
It is likely that some pieces may still be missing. For instance, the main approach for the map production is supervised classification. This means that we use machine learning algorithms to infer which land cover class is present at every given site using the images as input data. For these machine learning algorithms to work, we need training data, that is, we need to know before hand the correct land cover class in some places so the algorithm can be calibrated.
This training data is usually called ground truth and it is expensive and difficult to get. In a global mapping context, this can be a major drawback. However, there are interesting initiatives which could be leveraged to help here. For instance, Geo-Wiki comes to mind as a possible source of training data.
As always, talk is cheap, but it seems to me that exciting opportunities are available for open and free quality global mapping. This does not mean that the task is easy. It is not. There are many issues to be solved yet and some of them are at the research stage. But this should not stop motivated mappers and hackers to start learning to use the data and the tools.
Rule of thumb for choosing DTW over other distances for time series analysis
I recently received an e-mail from a former student of a course about time series analysis that I teach at ISAE asking me about dynamic time warping (DTW). Since this is a frequently asked question, I thought it would be useful to write my answer here for further reference.
The classical question many people ask when first introduced to DTW is when to choose DTW instead of other distances for time series analysis.
People usually quickly grasp the advantages of DTW over the Euclidean distance, since the latter needs perfect temporal alignment between the 2 time series being compared. However, many people get confused when they have in mind linear correlation's invariance to scale changes.
Linear correlation is indeed invariant to scale, but it still needs that the samples of the time series are perfectly aligned. To put it simply, this invariance applies to the values of the samples and not to their temporal position.
DTW does not have this invariance, but, as for any other distance, it can be obtained by normalizing the time series before computing the distance (subtraction of the mean and division by the standard deviation, for instance). On the other hand, DTW is robust to temporal distortions, like temporal shifts of the samples.
Another important property of DTW is that it can be applied to pairs of time series having different number of samples. This can be very useful in applications where some samples can be considered invalid or are censored, like for instance cloudy pixels in optical satellite image time series.
Therefore, it is the job of the user to choose the one which best fits the problem at hand.
For more information about DTW, you can check François Petitjean's web site where you can get an interesting paper about the use of DTW for remote sensing image time series1 and also Java code implementing DTW.
Footnotes:
F. Petitjean, J. Inglada & P. Gançarski Satellite Image Time Series Analysis under Time Warping IEEE Transactions on Geoscience and Remote Sensing, 2012, Vol. 50, Num. 8, pp. 3081-3095. doi: 10.1109/TGRS.2011.2179050
PROBA-V Preparatory Programme - PRO-Fusion
PROBA-V stands for PRoject for On-Board Autonomy - VEGETATION and is a space mission aimed at ensuring the data continuity between the Végétation missions (on board of CNES' SPOT-4 and SPOT-5) and ESA's Sentinel-3. PROBA-V has a Preparatory Programme funded by Belspo, the Belgian Federal Scientific Policy Office. I am PI for one of the selected projects of this programme. As such, I participated at the end of February to one of the International Users Committee to present the goals of the project. The project is called PRO-Fusion and it aims at developing and assessing algorithms for the fusion of PROBA-V images with other types of images as for instance Venus or Sentinel-2. The slides of my presentation are available here.
One interesting thing of this project is that the source code of the algorithms will be available as open source software. I have already started to contribute some code to the Orfeo Toolbox. The main contributions involve the multi-temporal processing.
HDF4 support for GDAL on Arch Linux
I have been trouble reading HDF files with OTB on Arch Linux for a while. I finally took the time to investigate this problem and come to a solution. At the beginning I was misled by the fact that I was able to open a HDF5 file with Monteverdi on Arch. But I finally understood that the GDAL pre-compiled package for Arch was only missing HDF4 support. It is due to the fact that HDF4 depends on libjpeg version 6, and is incompatible with the standard current version of libjpeg on Arch. So the solution is to install libjpeg6 and HDF4 from the AUR and then regenerate the gdal package, who, during the configuration phase will automatically add HDF4 support. Here are the detailed steps I took:
Install libjpeg6 from AUR:
mkdir ~/local/packages
cd ~/local/packages
wget http://aur.archlinux.org/packages/libjpeg6/libjpeg6.tar.gz
tar xzf libjpeg6.tar.gz
cd libjpeg6
makepkg -i #will prompt for root psswd for installation
Install HDF4 from AUR:
cd ~/local/packages
wget [[http://aur.archlinux.org/packages/hdf4-nonetcdf/hdf4-nonetcdf.tar.gz]]
tar xzf hdf4-nonetcdf.tar.gz
cd hdf4-nonetcdf
makepkg -i #will prompt for root psswd for installation
Setup an Arch Build System build tree
sudo pacman -S abs
sudo abs
mkdir ~/local/abs
Compile gdal
cp -r /var/abs/community/gdal ~/local/abs
makepkg -s #generated the package without installing it
sudo pacman -U gdal-1.8.0-2-x86_{64}.pkg.tar.gz
If you are new to using AUR and makepkg, please note that the AUR package installation need the sudo package to be installed first (the packages are build as a non root user and sudo is called by makepkg). Step 3 above is only needed if you have never set up the Arch Build System on your system.
Understanding map projections
Map projections are both easy and tricky. I am not a specialist at all about the subject, but I have used them a little bit.When I say that map projections are easy, I mean that, even without understanding them completely, there are tools which allow a user to get the work one. Of course, I use the Orfeo Toolbox library, which in turn uses the OSSIM library.
Actually, some years ago, with a student, we designed the interface in order to integrate OSSIM map projections (and sensor models too) into OTB so that they could be used as the existing geometric transforms already available in OTB (which came from ITK). The only thing we had to understand in order to design this interface was that map projections are coordinate transformations. Then, we chose the appropriate object-oriented design pattern together with a bit of C++ templates for the generic programming ingredient and that was it. When some users started using the projections (well, WE were those users) questions arised about the projections themselves. The task in answering to these questions would have been much easier if we had had this info (posted by Caitlin Dempsey on GIS Lounge):
The USGS has posted a scanned file of John P. Snyder's 1987 "Map Projections: A Working Manual" online in PDF and DjVu format. The beginning of the book contains substantial introductory information about map projection families and distortions. Each projection is started with a useful summary of the context and usage of that particular projection. Snyder then delves into detail about the history, features, and usage before providing the mathematical formulas used to calculate the projection.
Traffic Monitoring with TerraSAR-X
I have just read this interesting article which describes away to measure vehicle speeds using space-borne SAR sensors. The article explains very clearly how Doppler effect can be used, either with one single image, or with an interferometric pair, to estimate the speed of cars or ships. DLR's TerraSAR-X system has always impressed me. It has been providing very high quality images from its launch. For having used the images, I can say that their geometrical quality is very good. And as far as I know, this is the only operational system in flight which is able to perform one-pass interferometry. So far so good. However, the article forgets to mention that these satellites acquire only 2 images per day on a given point of the Earth's surface – typically in the morning and in the evening – so one can not expect to use this technology for real-time traffic monitoring. So you don't need to worry about getting a ticket for speed.
Teenager contribution for remote sensig
Check out this article. A teenager proposes an instrument concept for measuring the temperature at the bottom of clouds. NOAA is testing it.
Multi-temporal series simulations
As I mentioned in a previous post, last September I participated to the Recent Advances in Quantitative Remotes Sensing Symposium. I presented several posters there. One of them was about the assessment of the classification accuracy of Venus and Sentinel-2 sensors for land cover map production. While the results of the study are interesting, I think that the most important thing that this paper shows is how a time series with realistic reflectance values can be simulated. The idea here is to find a good balance between image synthesis (low accuracy) and physically sound simulation (need for ancillary data and computational complexity). The choice made here is to use a real time series of Formosat-2 images (only 4 spectral bands) in order to simulated Venus and Sentinel-2 time series with the same temporal sampling but with more than 10 spectral bands. The Formosat-2 time series is used in order to:
- Estimate the LAI (leaf area index) for each pixel
- Give a spatial distribution using a land-cover map
A database containing leaf pigment values for different types of vegetation is used together with the above-mentioned LAI estimation in order to drive a reflectance simulator. The simulated reflectances are then convolved with the relative spectral responses of the sensors in order to generate the simulated images. The poster presented at RAQRS 2010 is here.
Reproducible research
I have recently implemented the Spectral Rule Based Landsat TM image classifier described in 1.
This paper proposes a set of radiometric combinations, thresholds and logic rules to distinguish more than 40 spectral categories on Landsat images. My implementation is available in the development version of the Orfeo Toolbox and should be included in the next release:
One interesting aspect of the paper is that all the information needed for the implementation of the method is given: every single value for thresholds, indexes, etc. is written down in the paper. This was really useful for me, since I was able to code the whole system without getting stuck on unclear things or hidden parameters. This is so rarely found in image processing literature that I thought it was worth to post about it. But this is not all. Once my implementation was done, I was very happy to get some Landsat classifications, but I was not able to decide whether the results were correct or not. Since the author of the paper seemed to want his system to be used and gave all details for the implementation, I thought I would ask him for help for the validation. So I sent an e-mail to A. Baraldi (whom I had already met before) and asked for some validation data (input and output images generated by his own implementation). I got something better than only images. He was kind enough to send me the source code of the very same version of the software which was used for the paper – the system continues to be enhanced and the current version seems to be far better than the one published. So now I have all what is needed for reproducible research:
- A clear description of the procedure with all the details needed for the implementation.
- Data in order to run the experiments.
- The source code so that errors can be found and corrected.
I want to publicly thank A. Baraldi for his kindness and I hope that this way of doing science will continue to grow. If you want to know more about reproducible research, check this site.
Footnotes:
Baraldi et al. 2006, "Automatic Spectral Rule-Based PreliminaryMapping of Calibrated Landsat TM and ETM+ Images", IEEE Trans. on Geoscience and Remote Sensing, vol 44, no 9.
Change detection of soil states
As I mentioned in a previous post, last September I participated to the Recent Advances in Quantitative Remotes Sensing Symposium. I presented several posters there. One of them was about the work done by Benoît Beguet for his master thesis while he was at CESBIO earlier this year. The goal of the work was to assess the potential of high temporal and spatial resolution multispectral images for the monitoring of soil states related to agricultural practices. This is an interesting topic for several reasons, the main ones being:
- a bare soil map at any given date is useful for erosion forecast and nitrate pollution estimations
- the knowledge about the dates of different types of agricultural soil work can give clues about the type of crop which is going to be grown
The problem was difficult, since we used 8 m. resolution images (so no useful texture signature is present) and we only had 4 spectral bands (blue, green, red and near infrared). Without short-wave infra-red information, it is very difficult to infer something about the early and late phases.However, we obtained interesting results for some states and, most of all, for some transitions – changes – between states. You can have a look at the poster we presented at RAQRS here.
Massive Remote Sensing
Some weeks ago I had the chance to assist to the 3r Symposium on Recent Advances in Quantitative Remote Sensing, RAQRS, in València, Spain. It was the first time I attended such a conference. I've been to nearly all IGARSS since 1998, but I had never been to a conference where the main topic was the physics of remote sensing of continental surfaces. All in all, it was a very interesting and inspiring experience and I learned a lot of things. Many of the talks and posters dealt with applications related to multi-temporal and metric to decametric resolutions. This is due to the fact that most of the phenomena of interest (as for instance, the Essential Climate Variables, ECVs for short) are best monitored at those resolutions. It was in this context that I heard the massive remote sensing expression. As I understand it, it makes reference to the future available flow of data produced mainly by the ESA's Sentinel missions. Indeed, with these sensors (and others as NASA's LDCM) a frequent complete cover of the Earth's surface by high resolution sensors will be available. And, in order for these data to be useful, fast and efficient automatic processing methods will be needed. This last sentence may seem as nothing new with respect to what has been said inn recent years about very high spatial resolution sensors, but I think that now there are several issues which make it really crucial:
- Always on: the Sentinels (at least 1 and 2) will always be acquiring data, so the amount of images will be huge.
- Data really available: I don't know if this has been officially validated by ESA, but, as far as I know, the images will be free of charge or at a minimum cost
- Physical reality: the sensors will not be just taking pictures, but provide many spectral bands which can not be easily visually analyzed.
So I think it's time to start taking this challenge seriously and addressing the tough points such as:
- How to produce global land-cover maps without (or with very little) ground truth?
- How to develop models and methods which can be ported from one site to another with minimal tuning?
- How to exploit the synergy between image data and ancillary data or between image modalities (Sentinel-1 and Sentinel-2, for instance).
Sweet Remote Sensing
For a few months now, I have been taking a look at software tools designed for kids' education. There are many of them available, but I have been focusing on the works of the community founded by S. Papert and Alan Kay, inventors of the Logo and Smalltalk programming languages respectively. Papert and Kay got inspiration from the pioneer figures of pedagogy Piaget and Montessori and they took constructivism as main leading path for their developments.
The main idea behind constructivism is that the kid (but also adults as a matter of fact) learn by doing and exploring concepts. Papert and Kay adapted this theory to the use of computers: computers are simulators of the physical reality and as such, they allow to learn by doing even for concepts for which a physical world experience would not be feasible. The Squeak eToys environment is a good example of this.
One thing that struck me is that these ideas lead to (among others) the following conclusion: give a kid a laptop loaded with open source software and an Internet and she can learn whatever she wants. This is not just theory. The best example of the application of this idea is the OLPC (One Laptop Per Child) project and its success.
The OLPC software is based upon a software suite called Sugar which is made of lots of so-called activities for different disciplines: math, languages, physics, etc. This open source environment allows a kid to learn things, not just by using the activities, but also by allowing her to look at the source code (how things are done).
The strength of this kind of environment is that it can be used at several levels which allow the user to use the optimal trade-off between power and easy of use.
I would like to see an analogous environment for Remote Sensing Image Processing and Analysis. The Orfeo Toolbox is of course a very good candidate for this, and many steps have been taken in this direction.
The work of architecture and integration of the best existing open source libraries (ITK, OSSIM, 6S, libSVM, etc.) has provided the kitchen sink, the power. The creation of bindings (python, java), has allowed to expand the ways in which this power can be accessed. Finally, the GUI-based application Monteverdi has made the point and click use of (a limited part of) this power possible. The availability of QGIS plugins demonstrates that other paths can be imagined to make OTB usable by non programmers.
However, there is still lots of work to be done in order to have a completely integrated environment where, from the same starting point, a user can navigate through the different levels of complexity and power. Even if this is not an easy goal achieve, I think that all the building blocks are available to progress in this direction. This may only be a (very) long term goal, but I think that the existence of this vision can help to federate a community and motivate people to contribute.
Open Remote Sensing
Right after the recent Haiti earthquake a community of volunteers put their efforts together in order to build up to date maps of the area in order to help the humanitarian aid on the terrain.
This community is the one who is contributing to Open Street Map (OSM), the wiki-like world wide map on the Internet. A detailed presentation about this activity can be watched here.
This kind of activity can only be carried out if the volunteers have the input data (images, gps tracks) and the appropriate tools (software).
In terms of software, the OSM people rely on open source state of the art tools which allow them to be quick and efficient. As far as I know, their infrastructure is based on OSGEO tools for the storage, the formats, the web services for edition and visualization, and so on.
So open people with open tools generating open maps is something which has been proven useful and efficient for a while now: just take a look at the status of OSM near where you live in order to convince yourself. This is another example of the Wisdom of Crowds phenomenon.
However, one thing which was really special in the Haiti case is the speed at which the maps where created after the earthquake. This may be surprising when one thinks that most of the work for OSM is based on gps tracks submitted by people which are on the terrain or by volunteers digitizing somewhat outdated aerial imagery.
In the Haiti case, what really allowed for a quick cartographic response was that space agencies and satellite image providers made freely available the images acquired not long before and after the event. This allowed for really accurate maps of the communication infrastructures and buildings as well as a damage assessment of those. Refugee camps could also be easily located.
Unfortunately, the availability of this kind of data is not usual. Even with initiatives as the Disasters Charter the images made available by the signing parties and the added value maps are distributed under licenses which are relatively restrictive.
And as one can easily understand, the open people using open tools to create open maps are completely useless if they don't have the images to work with. Many people will agree on the fact that this should change when lives are at stake. Other people will think that, even for general purpose cartography, data should be freely available. Of course, space agencies, the aerospace industries, etc. have hard (economical and industrial) constraints which don't allow them to give away expensive images.
And of course, a bunch of volunteers don't have the resources to put satellites in orbit and acquire images. One thing is writing free software and another thing is rocket science! Or is it?
It seems that a group of people are thinking about doing things not far from that.
The Open Aerial Map project aims at building a world wide cover with free aerial images. Even if the project has been dead for a while, it seems to be active again.
Another interesting initiative is the Paparazzi project which aims at building open source software and hardware for aerial unmaned vehicles. One of the projects using it is made by the University of Stuttgart and aims at developing a system for high resolution aerial imagery.
The list of interesting free projects which could be used to setup an open source global nearly real time mapping system is long. It is likely that all the bricks will be put together someday by volunteers.
If this comes to reality, I suggest just one restriction on the license: the user wanting to print the map will have to read Borges' "Universal History of Infamy" before choosing the scale.
Short revisit cycle and temporal sampling
There is a somewhat recent trend in the development of new sensing remote satellite systems toward short revisit cycle (that is a high temporal resolution). Future systems such as Venµs or the Sentinels will be providing images of a given site every 2 to 5 days.
One may wonder which real applications may need this high temporal resolution. Although there are some applications which need it, it is also true that most of the applications foreseen for these systems will work with fewer images per period of time.
However, there are several point to take into account when we think about temporal sampling. First of all, at least for optical systems, the cloud cover can make unusable a high percentage of the images which are acquired by the sensors. Second, even if the mean number of images per year for a given application may be low, some of the applications may need a higher temporal resolution during some periods of the year (example of the phenology of crops). And the fact is that flight mechanics make easier to keep the same orbit all over the life span of a satellite.
And last, but not least, many new applications can emerge when this kind of data is made available to scientists.
In the coming versions of the Orfeo Toolbox, specific tools for image time series will be made available in order to help the users of this kind of data to use them efficiently.
Open tools for modeling and simulation
I has been now nearly 2 months since I moved to a new job. My research subject has slightly evolved, from sub-meter resolution image information extraction (mainly object recognition for scene interpretation) towards high temporal resolution for environment applications. The change in the resolution dimension (from spatial to temporal) is the main re-orientation of the work, but if I have to be honest, this would not be challenging enough to justify leaving what I was doing before, the nice colleagues I had (though the new ones are also very nice), etc.
The main challenge of the new job is to dive in the world of physics and modelling. Although I did a lot of physical modelling and simulation in my PhD, this was 10 years ago and it was SAR over the ocean, while now it is mainly optical over continental surfaces.
I have the chance to have landed on a lab with people who are specialists of these topics, so I can ask lots of questions about very specific issues. The problem is that I am lacking basic knowledge about state of the art approaches and I don't like to bother my new colleagues (since they are nice!) with stupid questions.
There is where open available ressources are very helpful. I will just cite 2 pointers among the lots of relevant stuff I am using for my learning.
In terms of modelling the physical and biological processes in an agricultural field, I found Daisy, which is an open source simulation system developed by Søren Hansen's team at the University of Copenhagen. Added to the source code, there is a very rich theoretical documentation available.
Once these processes are understood and simulated, I was also interested in learning how things can be measured by optical sensors. I found Stephane Jacquemoud's PROSAIL approach for which source code and reference documentation (papers, PhD dissertations) are available online.
From there, I just put things together in order to learn with a hands on approach. PROSAIL is Fortran and Daisy is C++. I wanted to plot some simulated vegetation spectra. So I fired up Emacs and started writing some python code in order to loop over variable ranges, launch the simulators, plot things with Gnuplot.py, and so on. And then, I remembered that we have python wrappers for OTB, which would make possible the use of the 6S radiative transfer code using OTB's internal version of it.
And here we are, with a fully open source system which allows to do pysics-based remote sensing. Isn't that cool?
Geospatial analysis and Object-Based image analysis
I was searching in the web about the use of PostGIS data bases for object based image analysis (OBIA) and Google sent me to the OTB Wiki to a page that I wrote 6 months ago (first hit for "postgis object based image analysis").
It seems that this is a subject for which no much work is ongoing. Julien Michel will be presenting some results about how to put together OBIA and geospatial analysis (+ active learning and some other cool things) in a workshop in Paris next May.
Simulation in remote sensing
Remote sensing images are expensive to buy. Remote sensing sensors are very, very expensive to design and build. Therefore, it may be interesting to know, before investing any money in images or sensors, which are the capabilities of an existing or future sensor.
In the Spring of 2009, Germain Forestier was a visiting scientist at CNES and we worked on this subject. We (well, it was actually him who did the work!) implemented a simple simulator which used several spectral data bases, a set of sensors’ spectral responses and generated as output the spectra which would have been obtained for each material of the database by each of the sensors.
Then, we just applied classification algorithms in order to assess the quality of the classification results for each sensor. This simulator did not integrate atmospheric effects or spatial resolution information, so the conclusions drawn can not be used as general truth. However, we could show interesting things such as for instance, that the better results obtained by Pleiades HR with respect to Quickbird are due to the different design of the Near Infra-Red band (full disclosure: I work at CNES, where Pleiades was designed). The detailed results of this work were published last Summer 1
After Germain’s leave at CNES, we have continued to work a little bit on the simulator in order to make it more realistic. We have already included atmospheric effects and plan to go further by introducing spatial resolution simulation. I am convinced that this is the way to go in order to cheaply assess the characteristics of a given sensor in terms of end-user needs and not only in terms of system quality issues as for instance SNR.
Footnotes:
G. Forestier, J. Inglada, C. Wemmert, P. Gancarski, Mining spectral libraries to study sensors’ discrimination ability, SPIE Europe Remote Sensing, Vol. 7478, 9 pages, Berlin, Germany, September 2009
